 Open Access



 Open access
 Check for updates


Abstract
The widespread application of dyes in the textile sector results in the production of highly pigmented and contaminated wastewater, which presents considerable environmental and health risks. This research examines the efficiency of dye removal using eco-friendly bio-adsorbents derived from sugarcane bagasse and rice husk, both of which are plentiful agricultural by-products. The synthesized bio-adsorbents are characterized through Fourier-transform infrared spectroscopy (FTIR), scanning electron microscopy (SEM), and X-ray diffraction (XRD) to evaluate their surface properties, structure, and crystallinity and amorphousness. Both agricultural wastes were subjected to drying, grinding, and chemical activation to enhance adsorption properties. The resulting composite bio-adsorbent was used on textile wastewater samples under controlled experimental conditions. Various adsorption tests were performed to analyze the removal effectiveness under different conditions, including contact time, pH, and dosage of the adsorbent. Furthermore, the effect of treatment on essential physicochemical parameters of the textile wastewater, such as pH, BOD, COD, total dissolved solids (TDS), electrical conductivity, salinity was examined. Kinetics adsorption study also shows here for analyzing the behavior and interaction between adsorbent and adsorbate. The results show a notable efficiency in color removal, supporting the viability of these affordable bio-adsorbents for sustainable and efficient wastewater treatment. For reactive dye waste water, bioadsorbent removed 80.13% color. For basic dye, it removed 87.80% color imparting particles. And for ETP inlet and outlet sample, the percentages were 73.56% and 44.12% respectively. The outcomes underscore a promising alternative to traditional treatment approaches by leveraging agricultural waste materials for environmental remediation.
Introduction
Textile Industry in Bangladesh contributes around 12% - 15% of in the total GDP of the nation [1]. The growth of the economy has facilitated the number of textile factories around the country. There are in total 4500+ textile mills operating in Bangladesh [2]. This growing number of factories produce large quantity of textile wastewaters which contains residual dye particles, inorganic salts, heavy metals, Nitrates (NO3−), nitrites (NO2−), Chlorides (Cl−), sulfates (SO42−), high pH, suspended particles, organic compounds etc. [3], [4].
There is a major concern about the color content present in wastewater which ranges around 1,890.8–5,625 CU. It clearly violets the permissible level of color unit in wastewater given by Department of Environment (DoE). Different types of filtrations, physical, biological and chemical procedures are available to treat the effluent to reduce the color unit. Among these methods adsorption process stands strong. In the recent times, adsorption is seen as a safe method to remove pollutants than other biological or chemical procedures as it does not initiate production of any secondary by-product which might be toxic and harmful for the environment [5], [6].
Adsorption process involves mass transfer of pollutant particles from the medium to the adsorbate. Bio adsorption is more eco-friendly and effective method of adsorption process [6]. Bioadsorbents are plant, animal, agricultural residue-based components that can trap contaminants through its porous surface structure. As bioadsorbent, rice husk and sugar cane bagasse has been chosen to remove color imparting dye particles from wastewater. Inlet effluent water of a Knit Composite textile factory, dyeing wastewater of reactive dye and basic dye from laboratory are the samples taken for the treatment.
Rice husk, a byproduct of rice milling, is readily available in substantial quantities, rendering it a cost-effective sourcing option. Rice husk possesses a porous, abrasive structure that effectively captures particles. It consists of cellulose, hemicellulose, lignin, and silica, which has Si–O–Si, Si–OH, –OH, and –COOH functional groups [7], [8].
Kinetic analyses indicate that the adhesion of dyes to rice husk adheres to pseudo-first-order or pseudo-second-order models [8]. This basically means the color removal process likely involves chemical bonding between the dye and the rice husk surface.
Another major component taken for bioadsorbent is sugarcane bagasse. The morphological structure of sugarcane bagasse is seen as rough, porous and hierarchical network typically of lignocellulose through SEM analysis. It has physical features like porosity, fiber strength, low density, and insulating properties. Both rice husk and sugarcane bagasse are best candidate for bio adsorbate. Rice husk has a surface area of ~10.3 m2/g and sugarcane bagasse have a slightly higher surface area of ~12.5 m2/g. Pore volume of rice husk is 15.7×10⁻³ cm3/g and 10.7×10⁻³ cm3/g for sugarcane bagasse, which means both provides a good adsorption site.
Chemical composition of both components suitable for hydrogen bonding, electrostatic attraction, and π–π interactions with dye molecules. Sugarcane bagasse and rice husk have emerged as viable natural materials for the remediation of dye-contaminated wastewater. The bagasse of sugarcane has a slightly higher surface area and is loaded with functional groups such as hydroxyl and carboxyl which increases its affinity for dye molecules, especially after basic treatments with acids or alkalis [9]. On the other hand, rice husk is better at removing a variety of colors, due to its inherent silica and lignin composition. These give it the ability to attract and hold onto dye molecules through electrostatic forces, ion exchange, and even chemical bonding [10], [11]. Rice husk and sugarcane bagasse are inexpensive, renewable, and locally available agricultural by-products with strong potential as sustainable adsorbents.
This study develops a combined rice husk–sugarcane bagasse bioadsorbent for treating both laboratory-prepared dye wastewater and real textile effluent samples, including reactive dye wastewater, basic dye wastewater, ETP inlet, and ETP outlet. The novelty of this work is to evaluate this combined bioadsorbent by adsorption performance, SEM, XRD, FTIR, kinetics, Langmuir isotherm and physicochemical analyses. The study highlights its potential as a low-cost pre-treatment option for reducing color and pollutant load before conventional ETP processing.
Materials and methods
Materials
The primary raw materials for the synthesis of bioadsorbent were rice husk and sugarcane bagasse. Sugarcane bagasse was purchased from local juice traders of Azampur, Uttara and rice husk was collected from Chandpur. Both materials were meticulously rinsed with distilled water to eradicate contaminants and subsequently air-dried for 48 hours to remove moisture. The dried raw materials are presented in Fig. 1(a, b) and were stored under ambient conditions prior to further processing.
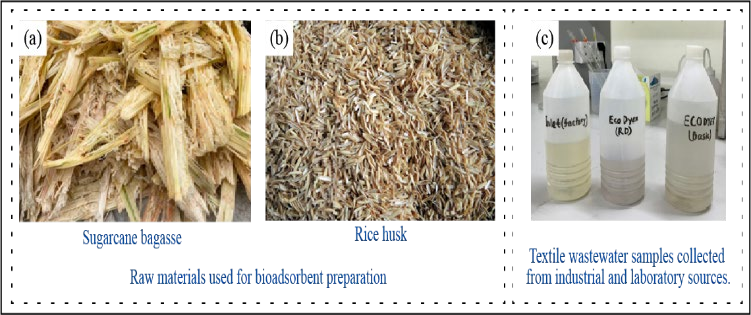
Textile wastewater samples were collected from a knit composite factory located in Savar, including both inlet and outlet effluent. In addition, wastewater generated from reactive and basic dyeing processes was collected from the laboratory. All the samples were collected in polypropylene bottles and kept in refrigeration conditions to maintain the original characteristics until the analysis. Fig. 1(c) shows the collected samples of wastewater.
Instrumentation
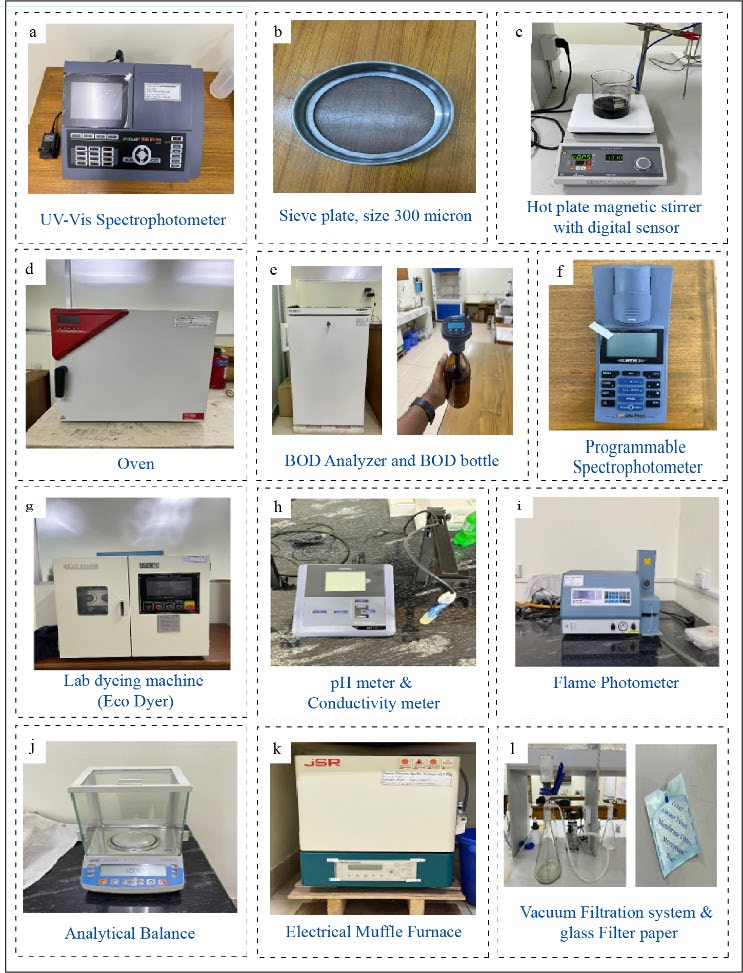
The bioadsorbent was prepared, the treatment experiments were conducted and the wastewater samples were analyzed for physicochemical parameters using standard laboratory instruments. Color was measured using a UV–vis spectrophotometer, while pH and conductivity meters were used to determine pH, electrical conductivity, total dissolved solids and salinity. Biological oxygen demand (BOD) and chemical oxygen demand (COD) were measured using the suitable analytical devices. Sample preparation and treatment involved the use of a hot plate magnetic stirrer, oven, muffle furnace, and vacuum filtration system. A flame photometer was utilized for the determination of metal ions, and an analytical balance was used for precise measurement of materials shown in Fig. 2.
Methodology
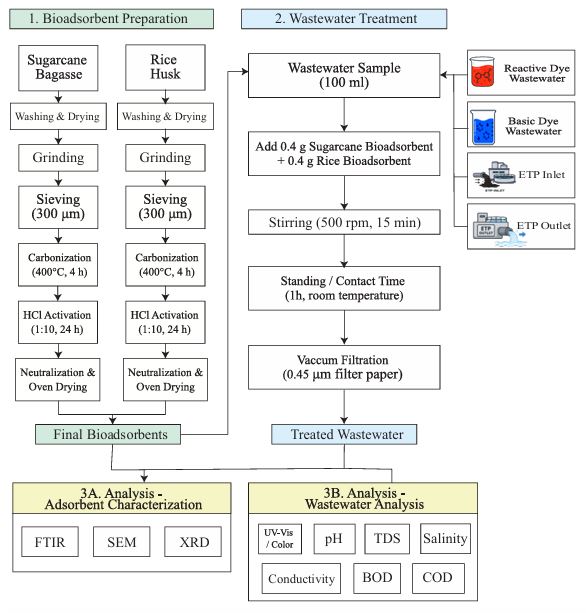
The whole procedure is divided into four major portions (Figure 3) -
a. Bioadsorbent Preparation.
b. Application of the bioadsorbent in different wastewater samples with changing multiple parameters.
c. Characterization of bioadsorbent.
d. Assessment after applying the bioadsorbent into the wastewater sample.
Preparation of Bioadsorbent
Sugarcane bagasse and rice husk were prepared following a similar procedure. After proper sun drying, both raw materials were separately ground using a grinder and sieved through a 300 μm sieve to obtain fine particles (Fig. 4). The sieved particles were then separated and stored in airtight bags. For carbonization, both sugarcane bagasse and rice husk samples were placed in a muffle furnace at 400 °C for 4 h.
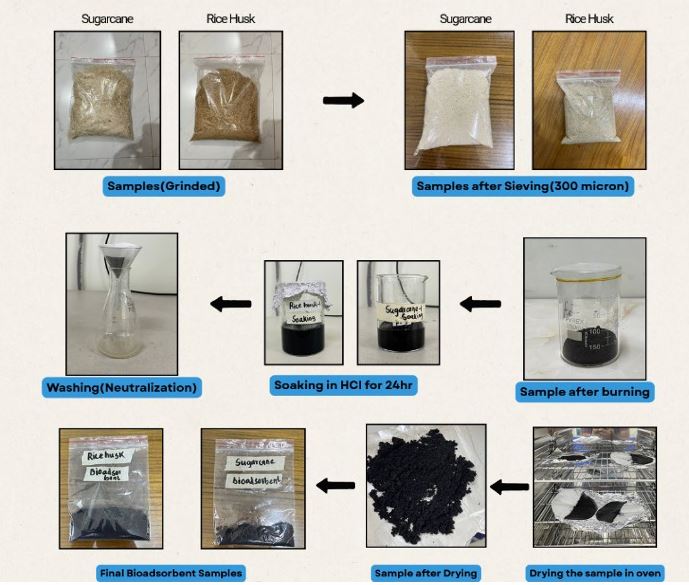
After carbonization, the obtained biochar samples were chemically activated using 65% laboratory-grade hydrochloric acid. The ratio of HCl to bioadsorbent was kept as 1:10 (mL:g), where 1 mL of HCl was used to 10 g of bioadsorbent. The samples were immersed in HCl for 24 h. The samples were washed multiple times with distilled water for neutralization after immersion and then dried in an oven at 105 °C for 12 h to evaporate the residual moisture. Finally, the prepared bioadsorbents based on sugarcane bagasse and rice husk were stored in airtight containers for subsequent wastewater treatment experiments [12], [13].
Standard application Procedure:
1. Bioadsorbent Preparation 2. Wastewater Treatment
a. 100 mL wastewater is taken into a beaker.
b. The standard room temperature is maintained.
c. 0.4 g sugarcane based bioadsorbent & 0.4 g rice husk based bioadsorbent is taken into the wastewater solution.
d. Stir the solution with 500 RPM for 15 minutes.
e. Keep the solution for 1 h.
f. After 1 h, the solution is filtered by using 0.45 Micron filter paper and bioadsorbent is separated from the solution.
g. After that, a portion of solution is taken for measuring the color value by using UV-vis spectrophotometer.
Different Parameters
For obtaining diversified results, several operating parameters were varied to enable comparative analysis and to identify the optimum conditions for bioadsorbent dosing [6]. The parameters considered include contact time (1, 8, 24, and 48 hours), dosing amount (0.2 g, 0.4 g, and 0.6 g for each adsorbent), agitation speed (500, 700, and 1000 RPM), and temperature (40, 60, and 80 °C).
Characterization techniques of textile effluent
Different physical and chemical parameters such as BOD, COD, pH, Salinity, color unit and Electrical conductivity of treated and untreated sample were measured using different machines of laboratory. pH refers to the concentration of H+ ions in a sample and it was measured using a pH meter of WTW brand. Color unit of the samples were measured using UV-vis spectrophotometer, Model photo lab 7600 (UV-Vis). Color unit helps in quantifying the amount of coloring particles present in water sample. Biological oxygen demand (BOD) indicates the total organic pollutant amount of any liquid sample. BOD Analyzer, brand WTW and model OxiTop-I IS & TS 608/G 2-I; along with BOD bottle is used to measure BOD. Another important parameter is Chemical oxygen demand (COD) that quantifies the amount of oxidizable pollutants a water sample hold. The machines used for COD are Thermostat, COD reactor and photo flex machine of WTW brand. The ability of any sample to carry electric charge is expressed through Electrical Conductivity (EC) and it is measured for wastewater sample using a Conductivity meter of WTW Brand, Model intoLab cond 7110. Salinity indicates the quantity of organic and inorganic salts present in a sample. Lastly, Total dissolved solid (TDS) helps to analyze the amount of ions, metals, solids residing in a sample in dissolved form. Both Salinity and TDS were measured using Conductivity meter of WTW Brand, Model intoLab cond 7110. Also flame photometer is used here for analyzing the amount of metal present in the wastewater samples before and after applying bioadsorbent.
Characterization of Bioadsorbent
The bioadsorbent was studied to elucidate its surface chemistry, morphology, and structural features that affect adsorption efficacy. The FTIR analysis was performed to determine the functional groups on the bioadsorbent surface responsible for the adsorption of pollutants [5]. This approach is helpful in providing important information on the surface chemistry and molecular structure by vibrational transitions of chemical bonds. Scanning Electron Microscopy (SEM) analysis was employed to examine the surface morphology, porosity, and textural characteristics of the bioadsorbent [6]. These characteristics directly influence the accessibility of active adsorption sites. XRD analysis was employed to determine the crystalline or amorphous nature of the material and to detect any structural changes after treatment or adsorption, offering insights into crystallinity and phase composition that influence adsorption behavior [5].
Study of Adsorption Kinetics
Adsorption kinetics is the study of the rate at which a solute (like a dye or contaminant) is removed from a solution by being attached to the surface of an adsorbent material (e.g., rice husk or sugarcane bagasse). This study tries to analyze adsorption kinetics via Pseudo First Order, Pseudo Second Order & Elovich model [6]. Then the results are represented via using Origin Pro software.
Pseudo Second Order [15]:
Elovich Model [16]:
The adsorption isotherm data for decolorization of dye by the bio-adsorbent synthesized from sugarcane bagasse and rice husk were analyzed with the Langmuir isotherm model [17]. The experimental results showed that the adsorption capacity (qe) increased with the increase in equilibrium concentration (Ce) of the dye, indicating a good adsorption behavior.
Result and discussion
Analysis of Bioadsorbent
The prepared bioadsorbents derived from rice husk and sugarcane bagasse were characterized by SEM, XRD, and FTIR analyses to evaluate their morphological, structural, and surface chemical characteristics. SEM analysis was used to observe the surface texture, roughness, and pore formation of the bioadsorbents. XRD analysis was performed to determine the crystalline or amorphous nature of the prepared adsorbents, while FTIR analysis was used to identify the functional groups involved in adsorption interactions. These characterization results support the evaluation of rice husk- and sugarcane bagasse-based bioadsorbents for textile wastewater treatment [6], [9].
SEM Analysis
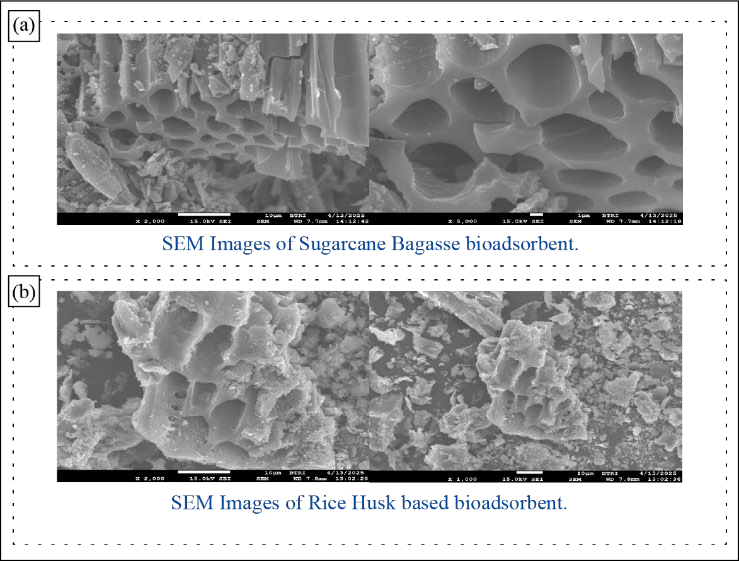
The surface morphology of the prepared sugarcane bagasse- and rice husk-based bioadsorbents was examined by SEM analysis, as shown in Fig. 5. The SEM micrographs revealed that both bioadsorbents had rough, irregular, and porous surface structures. The sugarcane bagasse-based bioadsorbent showed an uneven surface with visible pores and cavities, while the rice husk-based bioadsorbent also showed a rough and porous morphology.
The porous and irregular surface structure may be related to the carbonization and chemical activation processes. Such morphology is favorable for dye adsorption because it can increase the contact between dye molecules and the adsorbent surface. The presence of surface cavities and pores may also support the physical entrapment of dye molecules within the adsorbent structure. Therefore, the SEM results indicate that the prepared bioadsorbents have suitable surface morphology for dye removal from textile wastewater.
XRD Analysis
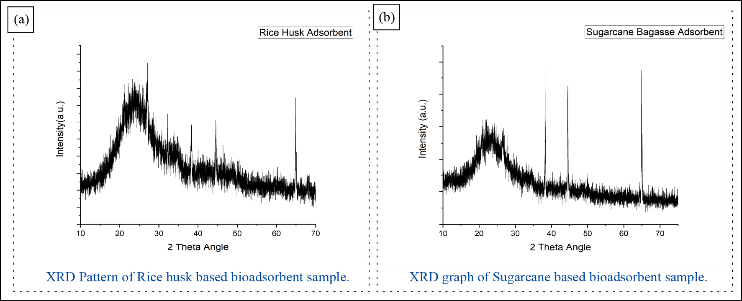
XRD analysis was performed to evaluate the structural properties and crystallinity of the prepared bioadsorbents, as shown in Fig. 6. The XRD pattern of the rice husk-based bioadsorbent showed a broad peak around 2θ = 22°, indicating the presence of amorphous silica and cellulose, which are common constituents of rice husk. The broad nature of this peak suggests low crystallinity, which may increase the accessibility of surface sites for dye adsorption.
At higher diffraction angles, sharper peaks were observed around 2θ = 37°, 45°, and 66°. These peaks may be assigned to minor crystalline phases, possibly crystalline silica or inorganic residues formed during activation or processing [18]. However, the absence of highly intense sharp peaks indicates that the rice husk-based bioadsorbent is mainly amorphous. This amorphous structure may support dye adsorption by providing irregular regions where dye molecules can interact with the bioadsorbent surface [19]. Thus, the XRD result supports the structural suitability of rice husk-based bioadsorbent for textile wastewater treatment [20], [21].
The XRD pattern of the sugarcane bagasse-based bioadsorbent also showed a broad peak around 2θ = 22°, indicating the presence of amorphous cellulose and lignin as major structural components [10], [22].
The sharp peaks detected at approximately 2θ = 37°, 45°, and 65° indicate the presence of minor crystalline minerals, which may originate from the chemical activation process or from inorganic components naturally present in the biomass [23]. The broad hump in the XRD pattern suggests that the material is mainly amorphous. This structural feature may improve surface accessibility and support interaction between dye molecules and the bioadsorbent surface.
Overall, the XRD results shown in Fig. 6 indicate that both rice husk- and sugarcane bagasse-based bioadsorbents are mainly amorphous with minor crystalline phases. This structure is favorable for adsorption because amorphous regions can provide accessible sites for dye molecules.
FTIR Analysis
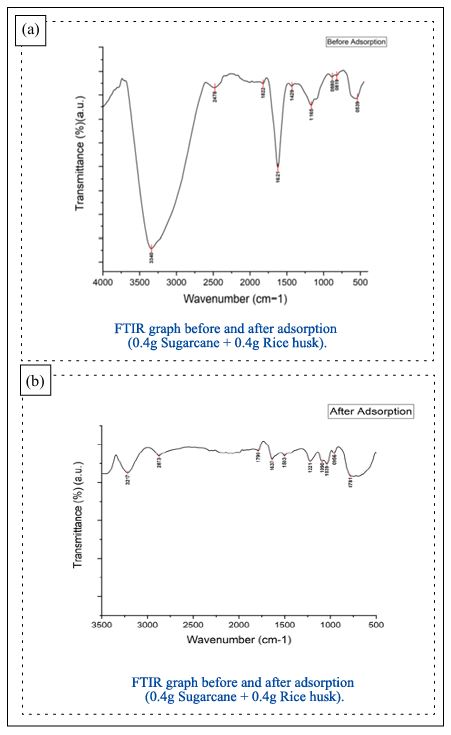
FTIR analysis was carried out before and after adsorption to identify the functional groups present on the surface of the combined bioadsorbent and to understand their possible involvement in dye adsorption. The FTIR spectra before and after adsorption are presented in Fig. 7.
Before adsorption, the FTIR spectrum showed several absorption peaks assigned to different functional groups. A broad and strong band at 3340 cm−1 was attributed to O–H stretching vibrations of hydroxyl groups present in cellulose, hemicellulose, and lignin components of lignocellulosic biomass [24]. The peak at 2478 cm−1 may be related to overtone or combination bands. The peaks at 1822 cm−1 and 1621 cm−1 were associated with C=O stretching of carboxylic acid or ester groups and conjugated carbonyl groups, respectively. A peak at 1429 cm−1 indicated C–H bending or aromatic skeletal vibrations. The peaks at 1165 cm−1 and 1080 cm−1 indicated C–O–C stretching of ether groups or C–O stretching of secondary alcohols [25]. The peaks at 881 cm−1, 819 cm−1, and 639 cm−1 were related to out-of-plane aromatic C–H bending and C–H deformation vibrations.
After adsorption, the FTIR spectrum showed changes in peak position and intensity, as shown in Fig. 7. The O–H stretching band shifted from 3340 cm−1 to 3217 cm−1 with reduced intensity, suggesting possible hydrogen bonding between hydroxyl groups and dye molecules [26]. The new peak at 2873 cm−1 can be assigned to C-H stretching vibrations affected by adsorbed dye molecules [24]. The carbonyl-related peak shifted from 1621 cm−1 to 1637 cm−1, and a new band appeared at 1790 cm−1, suggesting the involvement of carbonyl-containing groups after adsorption [21]. The peaks at 1503 cm−1, 1221 cm−1, 1109 cm−1, 1039 cm−1, and 956 cm−1 were assigned to C=C, C–O, and aromatic structures. These changes may be related to π–π interaction, electrostatic attraction, or possible surface complexation with dye molecules. A broad band at 781 cm−1 may be assigned to aromatic or heteroatom-containing groups involved in the adsorption process [27].
The appearance, disappearance, shifting, and intensity changes of FTIR peaks after adsorption indicate the participation of surface functional groups in the dye removal process. The hydroxyl, carbonyl, ether, and aromatic groups present in the rice husk- and sugarcane bagasse-based bioadsorbent may have contributed to dye adsorption through hydrogen bonding, electrostatic interaction, π–π interaction, and possible surface complexation. Therefore, the FTIR results shown in Fig. 7 support the role of surface functional groups in the adsorption of dye molecules.
Physicochemical analysis of textile effluent
The physicochemical properties of the four wastewater samples (Table 1-4) were analyzed before and after treatment with the rice husk- and sugarcane bagasse-based bioadsorbent. The prepared bioadsorbent was evaluated for the treatment performance based on the changes in pH, TDS, salinity, electrical conductivity, BOD, COD and color in the selected samples such as reactive dye wastewater, basic dye wastewater, ETP inlet and ETP outlet.
The pH values of all treated samples were shifted towards the permissible range for the discharge of textile effluent. The reactive dye wastewater showed reduction in pH from 9.00 to 7.45, whereas the basic dye wastewater increased from acidic pH 4.90 to 7.67 after treatment. Likewise, the pH of ETP inlet decreased from 8.42 to 7.21 and ETP outlet decreased from 7.70 to 6.50. This indicates that the prepared bioadsorbent showed a buffering effect which helps in neutralizing both acidic and alkaline wastewater samples.
TDS was significantly reduced after treatment. TDS of reactive dye wastewater was decreased from 619 mg/L to 170 mg/L and basic dye wastewater was decreased from 715 mg/L to 212 mg/L. For ETP inlet and ETP outlet TDS was decreased from 383 mg/L to 170 mg/L and from 688 mg/L to 472 mg/L respectively. This reduction may be due to the porous structure and active functional groups of the bioadsorbent which can help in entrapping the dissolved ionic and organic constituents [28].
The most significant indicator of the treatment performance was the color removal. The maximum colour removal was observed for the basic dye wastewater where the colour value was decreased from 451 CU to 55 CU i.e., 87.80 % removal. Reactive dye wastewater also showed good color reduction from 458 CU to 91 CU with 80.13 % removal. The ETP inlet sample experienced 73.56% color removal reducing from 174 CU to 46 CU. The ETP outlet experienced a lower color removal efficiency of 44.12% which may be due to the pretreated condition and lower initial load of color. These results indicate that the prepared bioadsorbent was more effective for highly colored dye wastewater and ETP inlet sample.
It was also found that the BOD and COD values decreased post treatment indicating a decrease in organic and oxidizable pollutant load. In reactive dye wastewater, BOD decreased from 650 mg/L to 293 mg/L and COD decreased from 1245 mg/L to 577 mg/L. In basic dye wastewater, BOD decreased from 810 mg/L to 236 mg/L and COD decreased from 1225 mg/L to 660 mg/L. In the ETP inlet sample, BOD decreased from 430 mg/L to 190 mg/L and COD decreased from 855 mg/L to 210 mg/L. The post-treatment sample obtained from the ETP outlet showed a comparatively lower reduction because the sample had already been treated prior to application of bioadsorbent. The decrease in BOD and COD indicates that the bioadsorbent contributed towards removal of organic pollutants from wastewater. The color reduction may be attributed to dye adsorption on the porous surface and interaction with active functional groups of the bioadsorbent, which is also supported by the kinetic behavior of the adsorption process [29].
Similarly, all the samples showed reduction in salinity and electrical conductivity after treatment. The reduction of the salinity and the conductivity implies that the dissolved salts and ionic species were partially removed by the bioadsorbent. The maximum reduction in conductivity was observed in basic dye wastewater where EC was reduced from 1428 µS/cm to 524 µS/cm. This indicates the effectiveness of the bioadsorbent in reducing the ionic load especially for highly contaminated dye wastewater.
The physicochemical analysis of prepared rice husk and sugarcane bagasse based bioadsorbent showed that the quality of wastewater was improved by reduction in color, TDS, salinity, conductivity, BOD and COD. The treatment showed good efficiency in terms of removal of the pollutants in the basic dye wastewater, reactive dye wastewater and ETP inlet sample. The comparatively lower removal in the ETP outlet sample might be due to the lower initial concentration of pollutants after the industrial treatment.
| Initial | After adding Bioadsorbent |
|---|---|
| pH = 9 | pH = 7.45 |
| TDS = 619 mg/L | TDS = 170 mg/L |
| Salinity = 0.5 | Salinity = 0.2 |
| Conductivity = 437 us/cm | Conductivity = 310 us/cm |
| BOD = 650 mg/L | BOD = 293 mg/L |
| COD = 1245 mg/L | COD = 577 mg/L |
| Color = 458 CU | Color = 91 CU |
| Initial Parameters | After Adding Bioadsorbent |
|---|---|
| pH = 4.90 | pH = 7.67 |
| TDS = 715 mg/L | TDS = 212 mg/L |
| Salinity = 0.7 | Salinity = 0.3 |
| Conductivity = 1428 µS/cm | Conductivity = 524 µS/cm |
| BOD = 810 mg/L | BOD = 236 mg/L |
| COD = 1225 mg/L | COD = 660 mg/L |
| Color = 451 CU | Color = 55 CU |
| Initial Parameters | After Adding Bioadsorbent |
|---|---|
| pH = 8.42 | pH = 7.21 |
| TDS = 383 mg/L | TDS = 170 mg/L |
| Salinity = 0.3 | Salinity = 0.1 |
| Conductivity = 776 µS/cm | Conductivity = 340 µS/cm |
| BOD = 430 mg/L | BOD = 190 mg/L |
| COD = 855 mg/L | COD = 210 mg/L |
| Color = 174 CU | Color = 46 CU |
| Initial Parameters | After Adding Bioadsorbent (0.2 g RH + 0.2 g SCB) |
|---|---|
| pH = 7.7 | pH = 6.5 |
| TDS = 688 mg/L | TDS = 472 mg/L |
| Salinity = 0.7 | Salinity = 0.5 |
| Conductivity = 1377 µS/cm | Conductivity = 1014 µS/cm |
| BOD = 28 mg/L | BOD = 25 mg/L |
| COD = 136 mg/L | COD = 101 mg/L |
| Color = 68 CU | Color = 38 CU |
Effect of parameters
Four samples of wastewater are taken here for the overall comparison-
i) Wastewater-1(Wastewater from Reactive Dye)
ii) Wastewater-2(Wastewater from Basic Dye)
iii) Wastewater-3(ETP Inlet)
iv) Wastewater-4(ETP Outlet)
Effect of Dosing Amount
Increasing dosing amount of bioadsorbents leading to high dye particles removal, which will eventually help to increase the dye removal percentage. The selected working dosage was considered as 0.4 g sugarcane bagasse bioadsorbent + 0.4 g rice husk bioadsorbent, as this dosage provided satisfactory dye removal while maintaining reasonable adsorbent consumption.
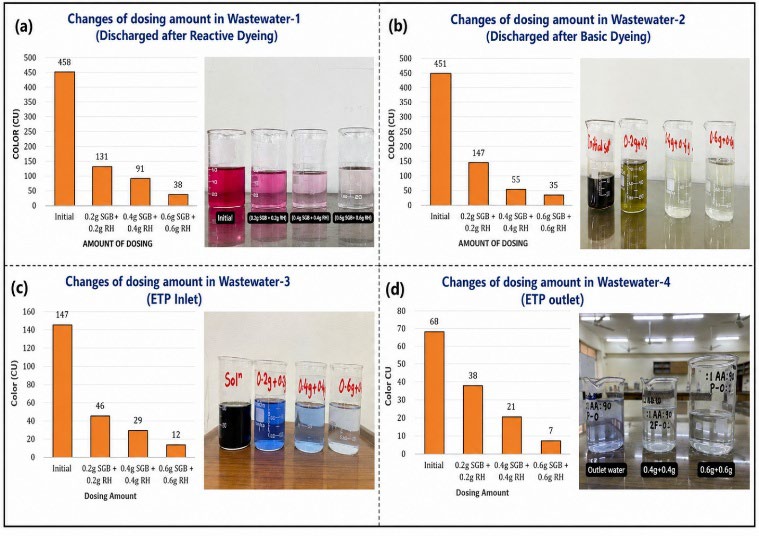
For the wastewater-1 (From Dyeing with Reactive Dye), the initial color value is found 458 CU. After adding the standard bioadsorbent dosing, the color value is observed 91 CU, which leads to 80.13% dye removal. For analyzing the dosing impact, dosing amount is reduced with (0.2 g sugarcane + 0.2 g rice husk), then it is applied into initial wastewater sample and result is seen 131 CU which leads to 71.3% removal of dyes.
After increasing the dosing amount (0.6g sugarcane + 0.6g rice husk), higher dye removal is seen with the value of 38 CU leading to 91.7% dye removal.
Similar manner is observed for the wastewater-2 (From Dyeing with Basic Dye) sample. The initial color value is observed 451 CU. After adding (0.2 g sugarcane + 0.2 g rice husk) bioadsorbent, it shows the color value 147 CU with 68.7% dye removal. By increasing the value of dosing (0.4 g sugarcane + 0.4 g rice husk), it increases its removal efficiency 87.8% with the value of 55 CU. Finally, the highest dosing amount (0.6 g sugarcane + 0.6 g rice husk) leads to maximum removal efficiency with 35 CU with 93.2% removal efficiency.
For wastewater-3 (ETP Inlet), the initial value is observed 174 CU. After adding the bioadsorbent dosing (0.2 g sugarcane + 0.2 g rice husk), it shows the color value 46 CU. After increasing the dosing value (0.4 g sugarcane + 0.4 g rice husk) and (0.6 g sugarcane + 0.6 g rice husk), the values are shown 29 CU and 12 CU respectively.
Wastewater-4 (ETP Outlet) is initially examined 68 CU. After adding (0.2 g sugarcane + 0.2 g rice husk), it shows 38 CU. Increasing dosing to (0.4 g + 0.4 g) and (0.6 g + 0.6 g) shows 21 CU and 7 CU respectively.
All these results are presented in Fig. 8(a–d), where increasing bioadsorbent amount results in higher dye removal efficiency across all wastewater samples.
Effect of Contact Time
Contact time influences the adsorption processes and it helps to eradicate more amount of dye particles which enhances the dye removal efficiencies.
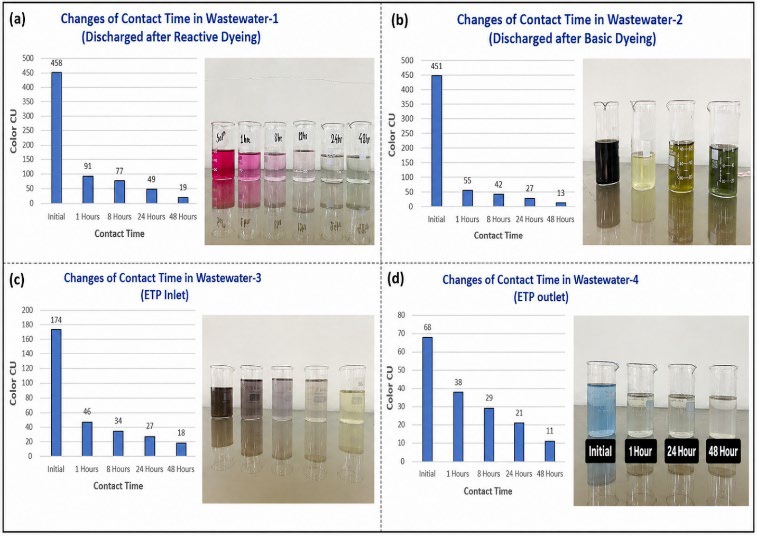
For wastewater-1 (From Dyeing with Reactive Dye), the initial concentration is recorded 458 CU. After adding standard amount of bioadsorbent (0.4 g sugarcane + 0.4 g rice husk), it shows the value 91 CU after 1 hour. After 8 hrs it shows 77 CU, after 24 hrs 49 CU and after 48 hrs 19 CU.
For wastewater-2 (From Dyeing with Basic Dye), initial value is recorded 451 CU and after 1 hour it shows 55 CU. Maximum dye removal is observed after 48 hours where the color value reduces to 12 CU.
Similar trend is observed in wastewater inlet and outlet samples. For wastewater-3 (ETP Inlet), initial value is 174 CU and reduces to 46 CU after 1 h, followed by further reduction with increasing time. For wastewater-4 (ETP Outlet), initial value is 68 CU and reduces to 38 CU after 1 h, with further decreasing trend over time.
All these data are presented in Fig. 9(a-d), which clearly demonstrates that increasing contact time enhances dye removal efficiency.
Effect of Agitation Speed
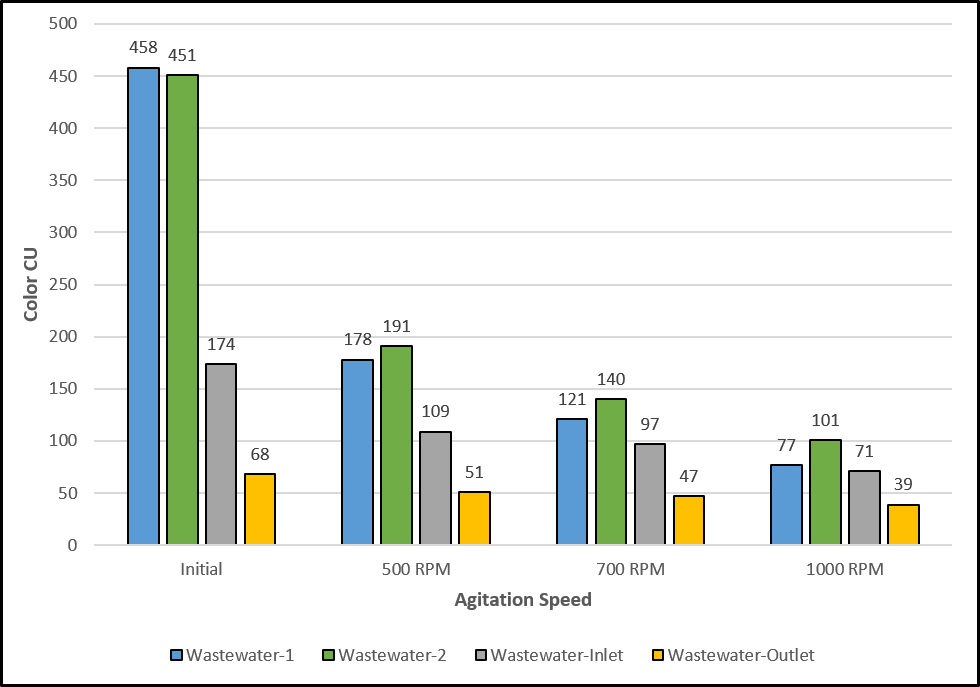
After adding the bioadsorbent to the wastewater sample, 500 RPM agitation for 15 min followed by 1 h contact time was selected as the standard working condition for comparative analysis. But changing the agitation speed also shows different values. Increasing agitation speed generally improves dye removal efficiency by enhancing mass transfer and dye adsorbent interaction. Stirring decreases the thickness of the boundary layer surrounding the bioadsorbent, enabling dye molecules to access the adsorbent surface more effectively. It guarantees even distribution of dye and adsorbent, enhancing the likelihood of interaction. Increased interaction between dye molecules and active sites results in faster adsorption [30].
For the wastewater-1 sample (From Dyeing with Reactive Dye), initial value is observed 458 CU. With the 500 RPM for 15 min, it shows the value 178 CU. With the increasing agitation speed, it shows the lower value of color. Sample trend is observed for the rest of the samples. All the data are observed in 100 mL wastewater solution, with adding 0.4 g sugarcane + 0.4 g rice husk) bioadsorbent and stirring time is maintained 15 min. From the graph, the most impacted values are seen for wastewater-1 (From Dyeing with Reactive Dye) & wastewater-2 (From Dyeing with Basic Dye) samples. For wastewater-1 sample, with the agitation speed 1000 RPM, the maximum dye removal is observed 83%. Wastewater Inlet sample also shows satisfactory changes and around 37% removal with 500 RPM, 44% with 700 RPM, 69% with the agitation speed of 1000 RPM. The least amount of changes is seen in wastewater outlet sample. This sample is already treated by the industry itself, maybe for this reason the changes are found in this way. The maximum removal efficiency is observed with 1000 RPM which is 42.64%. But all of these samples follow the same trend of removing more dyes with the increasing of agitation speed.
Although higher adsorbent dosage, longer contact time and higher agitation speed showed higher color removal efficiencies, 0.4 g sugarcane bagasse bioadsorbent + 0.4 g rice husk bioadsorbent, 1 h contact time and 500 RPM agitation speed were selected as the standard working conditions for comparison as they gave effective dye removal with less material use, shorter treatment time and reduced energy demand. Under this condition, the color values of reactive dye, basic dye, ETP inlet and ETP outlet samples were reduced to 91 CU, 55 CU, 46 CU and 38 CU respectively, which indicates satisfactory color removal within a practical treatment time. The higher conditions like 0.6 g dosage, 48 h contact time and 1000 RPM agitation speed represent maximum removal conditions but they require more adsorbent, longer processing time and higher energy input. Hence, the selected condition was considered as a practical working condition and not the absolute maximum removal condition. Information are given in Fig. 10.
Impact of Temperature
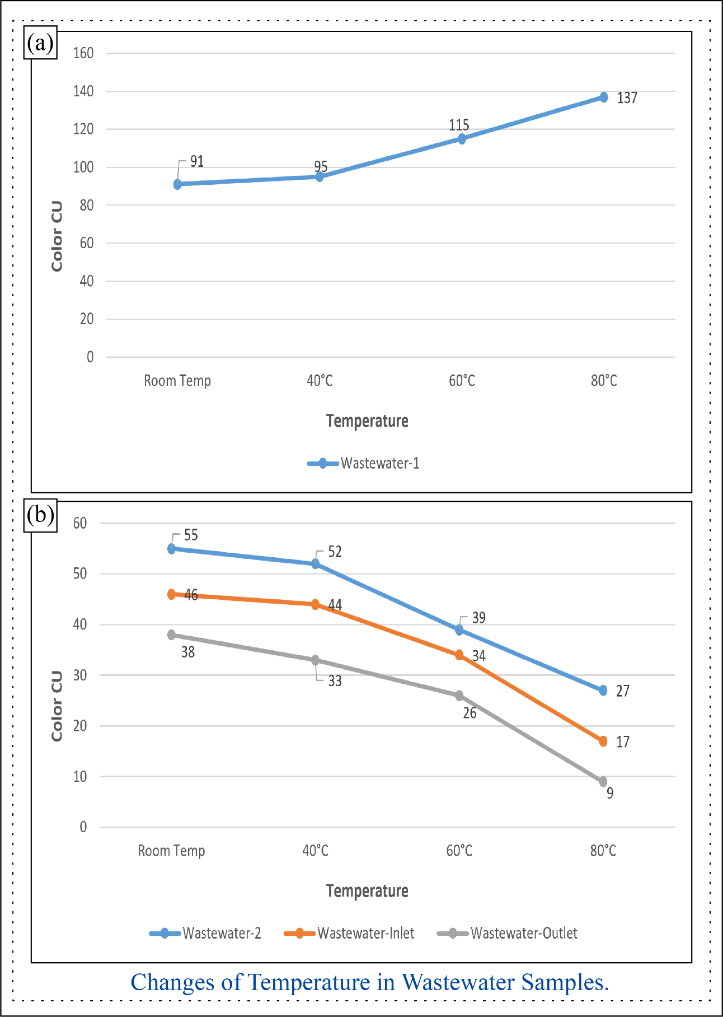
The effect of temperature on the decolorization was studied by varying the temperature of the treatment to 40, 60 and 80 °C (Fig. 11). All experiments were carried out using 100 mL of wastewater solution containing 0.4 g sugarcane bagasse bioadsorbent and 0.4 g rice husk bioadsorbent and 1 h contact time. The results showed that the response to temperature was different depending on the type and composition of the wastewater sample. The initial color concentration of wastewater-1 was 458 CU which was the reactive dye wastewater. The treated color value by bioadsorbent for 1 h at room temperature was 91 CU. But, at higher temperature to 40 °C, the color value was slightly increased to 95 CU and the increasing trend was continued at higher temperature. The color removal efficiency from reactive dye wastewater was decreased at higher temperature [31]. The different behaviour of reactive dye wastewater may be associated with the exothermic nature of its adsorption process. Weak interactions such as hydrogen bonding, electrostatic attraction and physical adsorption between reactive dye molecules and the bioadsorbent surface may become unstable at higher temperature. Accordingly, some dye molecules previously adsorbed may desorb from the adsorbent surface and revert back to the solution, causing increase in colour value. Also, reactive dye wastewater may contain salts and auxiliary chemicals used in the dyeing process that compete with dye molecules for available adsorption sites and therefore reduce the stability of adsorption at higher temperature. Therefore, increasing temperature did not improve the adsorption performance for reactive dye wastewater.
On the other hand, wastewater-2, wastewater-3 and wastewater-4 exhibited decreasing color values with increasing temperature. For wastewater-2 which was a basic dye wastewater, the color value decreased from 55 CU to 27 CU at 80 °C. This behavior indicates that the basic dye adsorption followed endothermic adsorption trend where higher temperature improved the mobility of dye molecules and enhanced the interaction with the active sites of bioadsorbent [32]. Similarly, wastewater-3, ETP inlet and wastewater-4, ETP outlet also displayed improved color removal at higher temperature. For wastewater-3, the color value decreased from 46 CU to 17 CU whereas for wastewater-4, it reduced from 38 CU to 9 CU. This improvement might be due to improved molecular diffusion, reduced boundary layer resistance and better accessibility of the dye molecules to the active adsorption sites of the bioadsorbent.
Overall, the temperature effect was sample dependent. For reactive dye wastewater, the decreased adsorption efficiency was observed at increased temperature, possibly due to partial desorption and competitive effects of salts and auxiliary chemicals. However, the basic dye wastewater and ETP samples exhibited improved removal efficiency at increased temperature due to enhanced diffusion and increased interaction between dye molecules and the bioadsorbent surface.
Study of Kinetics
Adsorption kinetic analysis was performed using the ETP inlet wastewater sample to evaluate the adsorption rate and fitting behavior of the prepared rice husk- and sugarcane bagasse-based bioadsorbent. For this experiment, 0.4 g sugarcane bagasse bioadsorbent and 0.4 g rice husk bioadsorbent were added to the wastewater sample. The solution was mixed properly, and aliquots were collected at different time intervals. The adsorbent was separated using 0.45 μm filter paper with a vacuum filtration setup, and the absorbance of the filtrate was measured using a UV–Vis spectrophotometer.
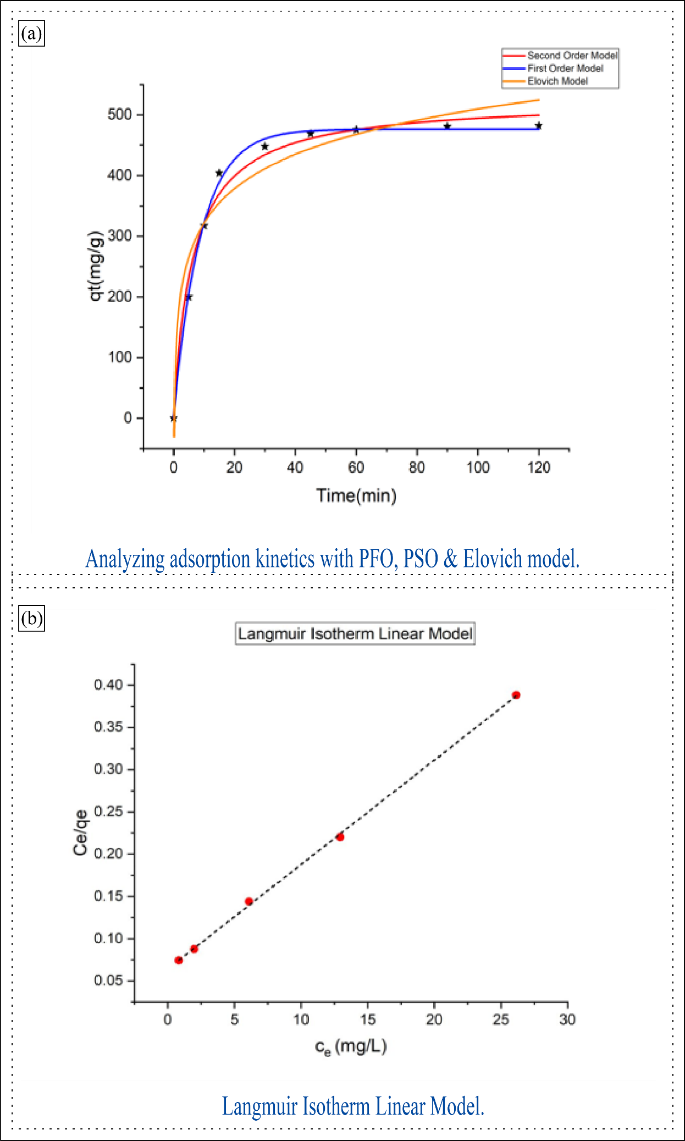
The adsorption capacity increased rapidly at the initial stage of adsorption. After 5 min, the adsorption capacity reached 200.21 mg/g, indicating rapid uptake of dye molecules due to the availability of active adsorption sites on the bioadsorbent surface. The adsorption capacity gradually increased with time and reached equilibrium at approximately 120 min, with an adsorption capacity of 482.2 mg/g. The initial rapid adsorption may be attributed to the availability of vacant active sites, while the slower adsorption rate at later stages may be due to the gradual occupation of adsorption sites and reduced driving force for mass transfer.
The kinetic data were fitted with pseudo-first-order, pseudo-second-order, and Elovich models, as shown in Fig. 12(a). The corresponding kinetic parameters and regression coefficients are presented in Table 5. Among the fitted models, the pseudo-first-order model showed the highest regression coefficient, with an R² value of 0.99775, followed by the pseudo-second-order model with an R² value of 0.96318. The Elovich model showed a lower R² value of 0.83339. This indicates that the adsorption process was better described by the pseudo-first-order model under the studied condition, while the pseudo-second-order model also showed acceptable fitting behavior.
The adsorption isotherm data for dye decolorization using the prepared sugarcane bagasse- and rice husk-based bioadsorbent were analyzed using the Langmuir isotherm model. The linear form of the Langmuir isotherm equation was plotted as Ce/qe versus Ce, as shown in Fig. 12(b). A straight line was obtained with a high correlation coefficient value of R² = 0.99923, indicating that the adsorption process followed the Langmuir isotherm model.
The calculated Langmuir isotherm parameters are presented in Table 6. The maximum monolayer adsorption capacity, Qmax, was calculated as 80.90615 mg/g from the slope and intercept of the Langmuir plot. This indicates that the prepared bioadsorbent has moderate adsorption capacity for dye removal from wastewater. The Langmuir constant, KL, was found to be 0.1927 L/g, suggesting favorable interaction between dye molecules and the active sites of the bioadsorbent.
The Langmuir separation factor, RL, ranged from 0.06 to 0.34, confirming that the adsorption process was favorable under the experimental conditions. Overall, the isotherm result suggests that dye adsorption occurred mainly through monolayer coverage on a homogeneous bioadsorbent surface.
The adsorption performance of the prepared rice husk- and sugarcane bagasse-based bioadsorbent was compared with similar agro-waste-based adsorbents reported in recent literature [33]-[39], as shown in Table 7. The present study showed a maximum Langmuir adsorption capacity of 80.91 mg/g, with color removal efficiencies of 80.13% for reactive dye wastewater, 87.80% for basic dye wastewater, 73.56% for ETP inlet, and 44.12% for ETP outlet. The comparison indicates that the prepared composite bioadsorbent showed moderate-to-good adsorption performance compared with similar rice husk- and sugarcane bagasse-based adsorbents.
| Kinetic model | Parameter 1 | Parameter 2 | Reduced Chi-square | R² | Adjusted R² |
|---|---|---|---|---|---|
| Pseudo-first-order | a = 478.41828 ± 4.03096 | b = 0.11211 ± 0.00399 | 71.81941 | 0.99775 | 0.99742 |
| Pseudo-second-order | qe = 518.6015 ± 0.96683 | k = 3.47148 × 10⁻⁴ ± 5.35182 × 10⁻⁶ | 273.11369 | 0.96318 | 0.96314 |
| Elovich model | A = 185.68529 ± 12.71422 | B = 0.01275 ± 1.84307 × 10⁻⁴ | 1235.80117 | 0.83339 | 0.83322 |
| Qmax (mg/g) | KL (L/g) | R² | RL |
|---|---|---|---|
| 80.90615 | 0.1927 | 0.99923 | 0.06–0.34 |
| Study | Adsorbent | Dye / wastewater type | Maximum adsorption capacity, Qmax (mg/g) | Removal efficiency (%) | Remarks |
|---|---|---|---|---|---|
| Present study | Rice husk + sugarcane bagasse bioadsorbent | Reactive dye, basic dye, ETP inlet and ETP outlet wastewater | 80.91 | 80.13, 87.80, 73.56 and 44.12 | Composite agricultural-waste bioadsorbent |
| [8] | Nascent rice husk | Methylene blue and crystal violet | 25.46 and 24.48 | NR | Lower capacity than present study; untreated/thermally treated rice husk |
| [33] | Modified rice husk | Crystal violet | 62.85–90.02 | NR | Xanthated rice husk showed higher capacity than charred rice husk |
| [34] | Sugarcane bagasse | Remazol Brilliant Violet-5R | NR | 92.22 | High removal efficiency using raw sugarcane bagasse biosorbent |
| [35] | Treated sugarcane bagasse cellulose | Crystal violet and methylene blue | 107.5 and 112.9 | NR | Chemically treated cellulose-based adsorbent showed higher Qmax |
| [36] | Sugarcane bagasse biochar | Remazol Brilliant Blue R | NR | 79–97 | Removal depended on biochar properties and dye concentration |
| [37] | Sugarcane bagasse and rice husk | Crystal violet | 61.35 and 58.82 | 93.9 and 92.9 | Present Qmax is higher than both SCB and RH reported in this study |
| [38] | Rice husk nanoparticles | Crystal violet and methylene blue | 94 and 75.4 | 97 and 92 | Nanoparticle form improved adsorption performance |
| [39] | Ferrihydrite-modified sugarcane bagasse biochar | Methylene blue and methyl orange | 141.75 and 138.25 | NR | Higher capacity due to ferrihydrite modification and enhanced surface charge |
NR = not reported in the abstract/available source.
Conclusion
The bioadsorbent developed from rice husk and sugarcane bagasse by grinding, sieving, carbonization and activation with hydrochloric acid showed an effective performance for the treatment of textile wastewater. The FTIR confirmed the presence of active functional groups like –OH, C=O and C–O–C, SEM revealed rough and porous surface morphology and the XRD was indicative of a predominantly amorphous structure supporting the dye adsorption. The pseudo-second-order kinetic model described the adsorption process, suggesting a chemisorption process, and the Langmuir isotherm confirmed the monolayer adsorption behavior.
The physicochemical parameters of the treated wastewater exhibited significant improvements such as BOD, COD, TDS, EC, pH and salinity. The color removal efficiencies of the bioadsorbent for reactive dye wastewater, basic dye wastewater, ETP inlet and ETP outlet were 80.13%, 87.80%, 73.56% and 44.12% respectively. Higher dosage, longer contact time and higher agitation resulted in higher removal efficiency, but 0.4 g of each adsorbent, 1 h contact time and 500 rpm agitation were selected as practical working conditions due to lower material use, shorter treatment time and reduced energy demand.
The developed bioadsorbent holds practical potential as a low-cost supplementary treatment material for textile wastewater especially for color reduction prior to conventional ETP treatment. Since rice husk and sugarcane bagasse are locally available agricultural wastes, this approach may reduce treatment cost while supporting sustainable waste valorization. However, further studies on regeneration, reuse, continuous-flow operation and pilot-scale performance are required before industrial implementation. The study showed that the developed bioadsorbent was very efficient for the removal of basic dye and can be an inexpensive and sustainable pre-treatment option for the reduction of the pollutant load before ETP processing.
Ethical Approval
It does not contain any experimental studies involving human participants or animal subjects performed by any of the authors.
Consent to Participate
Not applicable. No human participants or patients were involved in this study.
Consent to Publish
All authors have reviewed the final version of the manuscript and give their explicit consent for publication in the journal. This study does not contain any individual person's personal data, likeness, or private identification.
Declarations
- Author contributions
Abdullah Shahrier: Conceptualization, Methodology, Formal analysis, Visualization, Writing – original draft preparation. Anika Tahmin: Conceptualization, Methodology, Formal analysis. Abdullah Anjum Tahha: Investigation, Data curation, Writing – review & editing. Sadiba Ahmed: Supervision, Validation, Critical revision of the manuscript. Puja Roy: Supervision, Validation, Critical revision of the manuscript. All authors read and approved the final manuscript.
- Funding
This research did not receive any specific grant from funding agencies in the public, commercial, or not-for-profit sectors.
- Data availability
Not applicable
- Competing interests
Not applicable
- Acknowledgments
The authors would like to express their gratitude to Bangladesh University of Textiles (Dept. of Environmental Science and Engineering) for providing the academic resources and technical infrastructure necessary to conduct this analysis.
References
- 1.Mondal, M. S. A., Uddin, M. M., and Akter, N., (2024). The Textile Industry in Bangladesh: Growth Trends, Challenges, and Future Prospects. Global Disclosure of Economics and Business, 13(1): 73-86
- 2.Bangladesh Textile Industry Statistics: Reports 2025.
- 3.Forgacs, E., Cserháti, T., and Oros, G., (2004). Removal of synthetic dyes from wastewaters: a review. Environment International, 30(7): 953-971
- 4.Hasan, M. K., Shahriar, A., and Jim, K. U., (2019). Water pollution in Bangladesh and its impact on public health. Heliyon, 5(8): 02145
- 5.Ali, I., (2012). New Generation Adsorbents for Water Treatment. Chemical Reviews, 112(10): 5073-5091.
- 6.Gupta, V. K. and Suhas, (2009). Application of low-cost adsorbents for dye removal – A review. Journal of Environmental Management, 90(8): 2313-2342.
- 7.Pereira, M. A., Pereira, K. R., Ferreira, G. M. D., Paiva, P. R. P. d., Guimarães Jr, J. B., Valadão, D. R. B., Arantes, L. S., and Fonseca, C. S., (2024). Evaluation of materials derived from rice husk as adsorbents of cationic and anionic dyes. Cerâmica, 70: eDXNP6972.
- 8.Quansah, J. O., Hlaing, T., Lyonga, F. N., Kyi, P. P., Hong, S.-H., Lee, C.-G., and Park, S.-J., (2020). Nascent Rice Husk as an Adsorbent for Removing Cationic Dyes from Textile Wastewater. Applied Sciences, 10(10): 3437.
- 9.Micheletti, D. H., Andrade, J. G. S., Porto, C. E., Barros, B. C. B., Rosa, S. L. F., Sakai, O. A., and Batistela, V. R., (2024). Valorization of agro-industrial wastes of sugarcane bagasse and rice husk for biosorption of Yellow Tartrazine dye. Anais da Academia Brasileira de Ciências, 96: e20231308.
- 10.Yang, Q., Wu, S., Lou, R., and Lv, G., (2011). Structural characterization of lignin from wheat straw. Wood Science and Technology, 45(3): 419-431.
- 11.Tchobanoglous, G., Stensel, H. D., Tsuchihashi, R., Burton, F. L., Abu-Orf, M., Bowden, G., and Pfrang, W., (2014). Wastewater engineering: treatment and resource recovery. McGraw-Hill Education.
- 12.Ahmed, A. E. and Majewska-Nowak, K., (2020). Removal of reactive dye from aqueous solutions using banana peel and sugarcane bagasse as biosorbents. Environment Protection Engineering, 46(3): 121-135.
- 13.Temesgen, F., Gabbiye, N., and Sahu, O., (2018). Biosorption of reactive red dye (RRD) on activated surface of banana and orange peels: Economical alternative for textile effluent. Surfaces and Interfaces, 12: 151-159.
- 14.Revellame, E. D., Fortela, D. L., Sharp, W., Hernandez, R., and Zappi, M. E., (2020). Adsorption kinetic modeling using pseudo-first order and pseudo-second order rate laws: A review. Cleaner Engineering and Technology, 1: 100032.
- 15.Ho, Y. S. and McKay, G., (1999). Pseudo-second order model for sorption processes. Process Biochemistry, 34(5): 451-465.
- 16.Chien, S. H. and Clayton, W. R., (1980). Application of Elovich Equation to the Kinetics of Phosphate Release and Sorption in Soils. Soil Science Society of America Journal, 44(2): 265-268.
- 17.Langmuir, I., (1918). The Adsorption of Gases on Plane Surfaces of Glass, Mica, and Platinum. Journal of the American Chemical Society, 40(9): 1361-1403.
- 18.Kamath, S. R. and Proctor, A., (1998). Silica Gel from Rice Hull Ash: Preparation and Characterization. Cereal Chemistry, 75(4): 484-487.
- 19.Kim, Y., (2015). Effect of thaw depth on fluxes of CO2 and CH4 in manipulated Arctic coastal tundra of Barrow, Alaska. Science of The Total Environment, 505: 385-389.
- 20.Della, V. P., Kühn, I., and Hotza, D., (2002). Rice husk ash as an alternate source for active silica production. Materials Letters, 57(4): 818-821.
- 21.Babel, S. and Kurniawan, T. A., (2003). Low-cost adsorbents for heavy metals uptake from contaminated water: a review. Journal of Hazardous Materials, 97(1): 219-243.
- 22.Ioannidou, O. and Zabaniotou, A., (2007). Agricultural residues as precursors for activated carbon production—A review. Renewable and Sustainable Energy Reviews, 11(9): 1966-2005.
- 23.Daifullah, A. A. M., Girgis, B. S., and Gad, H. M. H., (2004). A study of the factors affecting the removal of humic acid by activated carbon prepared from biomass material. Colloids and Surfaces A: Physicochemical and Engineering Aspects, 235(1): 1-10.
- 24.Demirbas, A., (2004). Effects of temperature and particle size on bio-char yield from pyrolysis of agricultural residues. Journal of Analytical and Applied Pyrolysis, 72(2): 243-248.
- 25.Boehm, H. P., (1994). Some aspects of the surface chemistry of carbon blacks and other carbons. Carbon, 32(5): 759-769.
- 26.Yu, J., Zhu, Z., Zhang, H., Qiu, Y., and Yin, D., (2018). Mg–Fe layered double hydroxide assembled on biochar derived from rice husk ash: facile synthesis and application in efficient removal of heavy metals. Environmental Science and Pollution Research, 25(24): 24293-24304.
- 27.Coates, J., Interpretation of Infrared Spectra, A Practical Approach, in Encyclopedia of Analytical Chemistry. 2006, John Wiley & Sons, Ltd. Copyright © 2000 John Wiley & Sons, Ltd. All rights reserved. 978-0-470-02731-8.
- 28.Yadav, M., Singh, N., Annu, Khan, S. A., Raorane, C. J., and Shin, D. K., (2024). Recent Advances in Utilizing Lignocellulosic Biomass Materials as Adsorbents for Textile Dye Removal: A Comprehensive Review. Polymers, 16(17): 2417.
- 29.Ige, A. O., Ogunsile, B. O., Ore, O. T., and Olawade, D. B., (2024). Adsorption of congo red from aqueous solution using rice husk, calcined kaolin clay, and microwaved rice husk clay hybrid. Discover Chemistry, 1(1): 9.
- 30.Tang, Y.-J., Zhang, W., and Zhong, J.-J., (2009). Performance analyses of a pH-shift and DOT-shift integrated fed-batch fermentation process for the production of ganoderic acid and Ganoderma polysaccharides by medicinal mushroom Ganoderma lucidum. Bioresource Technology, 100(5): 1852-1859.
- 31.Salleh, M. A. M., Mahmoud, D. K., Karim, W. A. W. A., and Idris, A., (2011). Cationic and anionic dye adsorption by agricultural solid wastes: A comprehensive review. Desalination, 280(1): 1-13.
- 32.Yetilmezsoy, K. and Sakar, S., (2008). Development of empirical models for performance evaluation of UASB reactors treating poultry manure wastewater under different operational conditions. Journal of Hazardous Materials, 153(1): 532-543.
- 33.Homagai, P. L., Poudel, R., Poudel, S., and Bhattarai, A., (2022). Adsorption and removal of crystal violet dye from aqueous solution by modified rice husk. Heliyon, 8(4): e09261.
- 34.Ullah, T., Gul, H., Khitab, F., Khattak, R., Ali, Y., Rasool, S., Khan, M. S., and Zekker, I. Adsorption of Remazol Brilliant Violet-5R from Aqueous Solution Using Sugarcane Bagasse as Biosorbent: Kinetic and Thermodynamic Studies. Water, 2022, 14, 3014. https://doi.org/10.3390/w14193014
- 35.salah omer, A., A.El Naeem, G., Abd-Elhamid, A. I., O.M. Farahat, O., A. El-Bardan, A., M.A. Soliman, H., and Nayl, A. A., (2022). Adsorption of crystal violet and methylene blue dyes using a cellulose-based adsorbent from sugercane bagasse: characterization, kinetic and isotherm studies. Journal of Materials Research and Technology, 19: 3241-3254.
- 36.Singh, M., Ahsan, M., Pandey, V., Singh, A., Mishra, D., Tiwari, N., Singh, P., Karak, T., and Khare, P., (2022). Comparative assessment for removal of anionic dye from water by different waste-derived biochar vis a vis reusability of generated sludge. Biochar, 4(1): 13.
- 37.Ropak, M., Nopur, M., Shikder, M., and Salma, U., (2025). Adsorption of crystal violet onto agricultural waste-derived biosorbents: a study of isotherm, kinetic and thermodynamic behaviours. Asian J. Chem., 37(11): 2781-2793.
- 38.Sayed, A., Behalo, M., Feteha, A., Younis, A., Keshawy, M., Yousry, R., and Abdel-Raouf, M. E., (2025). Unveiling the removal performance of banana peel biochar and rice husk nanoparticles for crystal violet and methylene blue dyes from aqueous media. Discover Environment, 3(1): 143.
- 39.Das, N., Barua, S., Kashem, M. A., Moniruzzaman, M., Bashar, M. S., and Islam, M. S., (2026). Dye removal from wastewater using ferrihydrite-modified sugarcane bagasse and biochar: Adsorption performance and modeling analysis. Environmental Challenges, 22: 101390.
Cite this article
Journal
Tahmin A, Shahrier A, Ahmed S, Tahha AA, Roy P. A Sustainable Wastewater Treatment Using Bioadsorbent Derived from Rice Husk and Sugarcane Bagasse. JoSEP. 2026;3(2):185-196. doi: 10.62275/josep.26.1000028.
Rights and permissions
© 2026
Cited by (0)
Citing works are not available yet.
About this article
- Received
- 8 June 2026
- Revised
- 11 July 2026
- Accepted
- 15 July 2026
- Published
- 25 October 2026
- Journal
- Journal of Science and Engineering Papers
- Volume / Issue
- 3 / 2
- Pages
- 185-196
- DOI
- 10.62275/josep.26.1000028