 Open Access



 Open access
 Check for updates


Abstract
Burning fossil fuels like coal, oil, and natural gas releases significant CO2, driving carbon emissions in electricity production. This contributes to global warming, leading to climate change, extreme weather, rising sea levels, and harm to ecosystems and human health. Achieving zero emissions requires transitioning to low-carbon energy sources. This study uses various Machine Learning (ML) models for predicting low carbon electricity generation additionally eXpalinalbe Artificial Intelligence (XAI) to elucidate how ML model works and suggest some important factor contributing to the models outcome. Among several ML models RF outperforms other by achieving MSE of 2.782, RMSE of 2.782, MAE of 1.443 and R2 of 99.3%. Also GBM and XGB performed closely as RF. When applying XAI tools like SHAP and Shapash to RF it reveals some important factors such as Electricity from renewables (TWh), Eectricity from fussil fuels (TWh) Renewable energy share in the total final energy consumption (%), and Electricity from nuclear. Which are crucial for future energy planning and policy decisions. Future study can use a more extensive data set, investigate economic aspects, and include real-time data to enhance predictive model performance.
Introduction
Electricity is vital for the progress of society and human civilization, serving as a key energy source that supports the steady growth of the global economy [1]. Over the past 20 years, the electricity system has faced increasing pressure to reduce CO2 emissions, meet rising demand, provide reliable and affordable services, and sustain economic growth [2]. Global electricity demand is projected to rise from around 20,100 terawatt-hours (TWh) per year in 2013 to between 30,000 and 37,400 TWh per year by 2040 [3]. Currently, electricity generation accounts for roughly 40% of global CO2 emissions, making it one of the largest contributors to greenhouse gases (GHG) [2]. To mitigate climate change, transitioning to low-carbon electricity sources like wind, solar, water, geothermal, and biomass is essential [4]. Accurately predicting electricity generation from these renewable sources can guide stakeholders toward sustainability and support climate strategies. Machine Learning (ML) models excel in handling large datasets, improving over time by uncovering complex patterns and extracting features from raw data [5]. Various studies shows that ML models can play a pivotal role in low carbon electricity predictions [6]. Although ML models frequently yield accurate predictions, their opaqueness makes it challenging to comprehend the logic underlying their judgments. This is especially troublesome when these forecasts affect important decision-making procedures. To solve this, eXplainable Artificial Intelligence (XAI) techniques offer post-hoc interpretations that enable us to determine which elements have the greatest impact on the model's predictions [7]. As far as we are aware, no prior research has utilized XAI to interpret the results of ML models in low-carbon electricity contexts. The contribution of this study is:
1. We develop a comprehensive approach to predict the production of low-carbon electricity by analysing and contrasting several ML models.
2. We demonstrate the global and local explainability to our best performed model using SHAP and Shapash.
3. We identify the most significant features that impact the performance of the ML models in prediction using global explanations.
The remaining parts of the paper are arranged as follows: Section 2 contains the relevant literature; Section 3 contains the techniques and materials; Section 4 contains the findings; and Section 5 contains the conclusion and suggestions for further research.
Literature review
This section provides an overview of previous studies on low-carbon electricity prediction, highlighting current approaches and recent advancements in the field.
There is diverse research worldwide with 13,767 publications on low carbon electricity both qualitatively and quantitatively while United States has along contributed 3074 publications in a spanning of quarter century [2]. To address difficulties and opportunities numerous forecasting techniques have been proposed in recent years [8]. Autoregressive integrated moving average (ARIMA), the grey models and the Linear Regression (LR) models are most often used traditional model for forecasting [9]. The main drawback of such model is they influenced by region that is different models require for different region and their pattern of electricity consumption or production [6]. ML is the popular models of forecasting in the quantitative research of low carbon electricity. Researchers have been interested in ML algorithms because of their improved performance and capacity to find nonlinear correlations. ML algorithms have demonstrated encouraging results in wind power prediction, providing a number of benefits over conventional methods. A new technique that uses ensemble learning to anticipate wind power generation one day ahead of time is described, effectively managing curtailment and turbine damage. For effective hyper-parameter tweaking a hybrid forecasting model combines Wavelet Packet Decomposition (WPD), Convolutional Neural Network (CNN) and Long Short-Term Memory (LSTM) where Sequential Model-Based Optimization (SMBO) is used for combines [10]. In the area of photovoltaic power forecasting, the two most used machine learning techniques are Support Vector Machine (SVM) and Artificial Neural Networks (ANN) [11]. SVM is used in biomass energy prediction to avoid the challenge of regression and classification [12].
Methodology
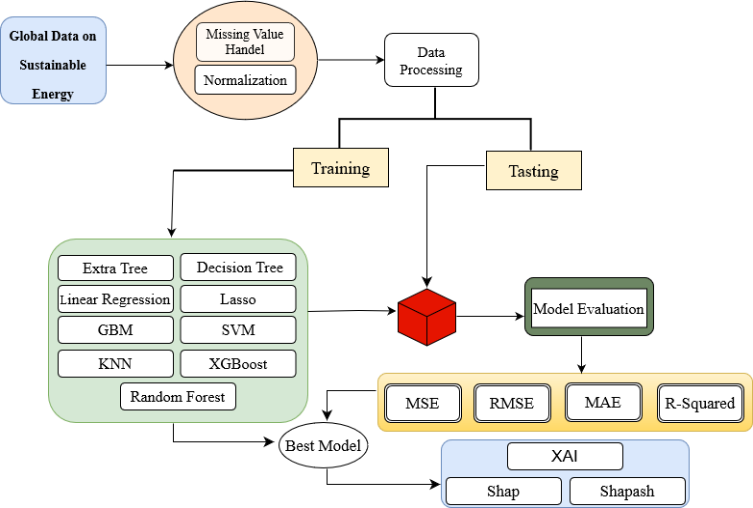
In this section, we describe the tools and techniques used in this study. We first use an overview diagram to show how the process works, and then we go into great detail about each individual part.
Approach overview
We employ a ML-based prediction system including various ML models such as Extra Tree Regressor (ETR), Decision Tree Regressor (DTR), LR, Lasso, Gradient Boosting Machine (GBM), Random Forest (RF), SVM, Extreme Gradient Boosting (XGB) and K-Nearest Neighbors (KNN) to our dataset. Assess the models' performance using a number of metrics, including Mean Absolute Error (MAE), Mean Squared Error (MSE), Root Mean Squared Error (RMSE) and R-Square R2. Then XAI tools like SHAP and Shapash are used to the final ML model to get most contributing features influencing the predictions. The overview of our proposed methodology is in Figure 1.
Dataset descriptions and preprocessing
The ‘Global Data on Sustainable Energy’ dataset, spans 20 consecutive years that is collected from Kaggle. A variety of features within the collection delve into significant issues like carbon emissions, energy intensity, renewable energy, electricity access, financial flows, and economic growth. However, for low-carbon electricity projections, nuclear and renewable energy are the most significant sources of electricity. We deal with the missing values and duplicates after filtering the data using both numeric and categorical columns. We replace the empty values with their average and eliminate the columns that have a significant number of missing data, such as “Capacity-per-capita-of-renewable-electricity-generating”, “Renewables (% equivalent primary energy)”, and “Financial flows to developing countries (US$)”. After completing preprocessing, the data is split into training and testing sets in different ratios. The training set is used to train the ML models, while the testing set evaluates model performance on unseen data. This ensures accurate assessment and generalization of the model to new data.
Description of ML algorithms
We have used several ML models in our prediction system. Due to limitation of space, we have added a simple description of the models here. We have used simple linear regression and Lasso model that are fitting a straight line, and make a connection between a dependent variable and one or more independent variables. The direction and strength of the link between the variables are shown by the coefficients [13]. Additionally, Lasso uses L1 regularization, which reduce over-fitting, making it especially useful for high-dimensional data [14]. DTR, KNN, and SVR models are used in this study. DTR is the mother of all tree-based ensemble model, KNN works based on the distance of the data points and SVR creates hyper line to generate accurate prediction. We have used ensemble ETR, XGB, RF, GBM in our study. Most of them are tree-based ensemble and construct different kinds of trees to ensure better analysis. So as to minimize variance and enhance prediction accuracy, the ETR constructs numerous unpruned decision trees utilizing random splits on subsets of the data and features. RF builds several DTs, trains them on arbitrary subsets of the data and features, and then averages the predictions made by each tree. XGB use advanced boosting approach combines the results of multiple weaker models, usually decision trees, to create a single, powerful predictive model. GBM uses gradient descent to minimize the loss function, gradually improving predictions by focusing on difficult-to-predict samples.
XAI tools
For explainability, we have used several XAI methods like SHAP and Shapash provide post-hoc interpretations by highlighting key factors that influence model predictions, offering clearer insights into outcomes. SHAP explains individual predictions by computing the contribution of each feature to the output, using game-theory principles for local and global explanations. Shapash, on the other hand, simplifies the interpretation by providing user-friendly visualizations of both local and global explanations, enhancing model transparency for various stakeholders.
Performance measure metrics
MSE measures the average squared differences between predicted and actual values, penalizing larger errors more heavily. RMSE is the square root of MSE, making it interpretable in the same units as the target variable and providing a more direct sense of prediction accuracy. MAE calculates the average of absolute differences between predictions and actuals, offering a more robust measure that is less sensitive to outliers. R2 represents the proportion of variance in the target variable explained by the model.
Result and analysis
This section presents the results based on the outlined contributions, starting with the performance of the ML models, followed by the explainability results, revealing the most influential factors in predicting low-carbon electricity production.
The results explain significant differences for various ML models that are listed in table Table 1. In our study RF emerged as the best performing model among others. RF model provides more effective MSE of 7.741, R2 of 99.3%, MAE of 1.443 and MSE of 2.782. Low error rates and high R2 make this model strongest choice of forecasting low carbon electricity generation. Though surpassed by RF, GBM and XGB also provide significantly more accurate predictions than other models. Additionally, SVM is the worst performer to predict the low carbon electricity generation with an MSE of 1075.046, R2 of 8%, MAE of 26.382 and RMSE of 32.787.
| Model | RMSE | R2 | MAE | MSE |
|---|---|---|---|---|
| ETr | 5.242 | 0.976 | 2.158 | 27.482 |
| Lasso | 18.158 | 0.717 | 14.021 | 329.745 |
| DTr | 5.165 | 0.977 | 2.220 | 26.687 |
| LR | 8.895 | 0.932 | 5.483 | 79.132 |
| SVM | 32.787 | 0.08 | 26.382 | 1075.046 |
| KNN | 11.266 | 0.891 | 5.05 | 126.926 |
| GBM | 2.999 | 0.992 | 1.806 | 8.997 |
| XGB | 2.812 | 0.993 | 1.580 | 7.909 |
| RF | 2.782 | 0.993 | 1.443 | 7.741 |
Explainable AI results
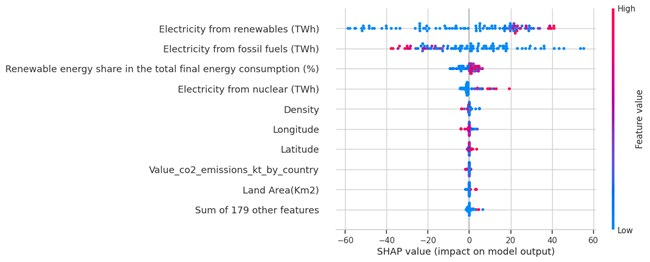
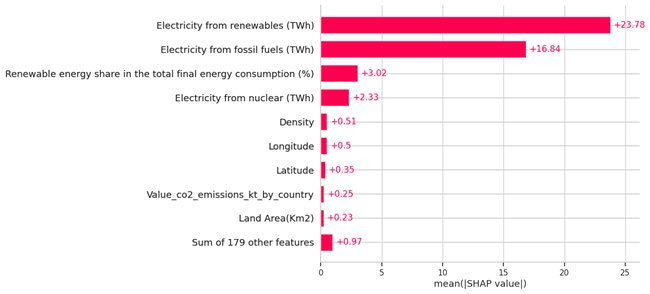
We utilize the XAI tools Shap for our optimal ML model performance. The global explanations provided by the shap summary plot highlight several significant factors, including Electricity from renewables (TWh), Electricity from fossil fuels (TWh) Renewable energy share in the total final energy consumption (%), Electricity from nuclear, and Density, as illustrated in Figure 2. This is additionally corroborated by the SHAP bar plot, which shows the average absolute SHAP value for the significant features shown in Figure 3.
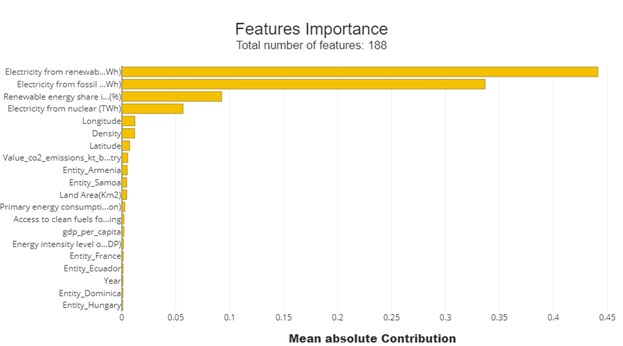
However, when applying the best ML model using the XAI tool Shapash. The Shapash feature importance plot likewise exposes the first four key elements, which are the same as Shap's. The fifth factor, which is Density given in Fig. Figure 4, is substituted by Longitude. Electricity from renewables (TWh), Electricity from fossil fuels (TWh) Renewable energy share in the total final energy consumption (%), Electricity from nuclear, are the main contributors from both approaches.
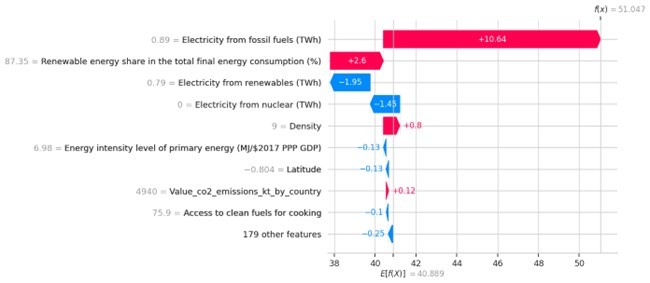
As a local explanation using Shap for the first observation, the red colour indicating the features that has positive contribution to the predictions and blue colour indicating the negative contributions listed in Figure 5.
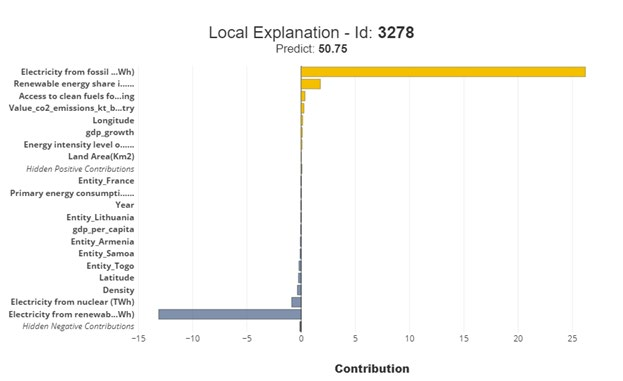
For the local explanation using Shapash for a randomly selected observation of ID 3278 shown in Figure 6. The yellow colour bar showing the positively contributing features and the grey colour showing negatively contributing features.
Conclusion
The main goal of this study is to predict low carbon electricity generation and suggest the best model for forecasting. RF perform better among all the model with lowest MSE, RMSE, and MAE additionally highest value of R2. Only a few additional models exhibit encouraging outcomes; the best two are XGB and GBM. The smooth integration of zero carbon electricity sources, grid stability, and efficient energy management all depend on their accuracy and dependability. Their exceptional precision lessens reliance on fossil fuels and takes one step ahead for zero carbon goal. Then XAI tools such as SHAP and Shapash based on RF model, reveals important features like Electricity from renewables (TWh), Electricity from fossil fuels (TWh) Renewable energy share in the total final energy consumption (%), and Electricity from nuclear. This research admits its limitations, such as the dataset's possible incompleteness and the analysis's lack of consideration of economic and policy aspects. It is essential to use a more extensive data set, investigate economic aspects, and include real-time data in order to further future study.
Ethical Approval
The submitted work is a unique contribution to the field, not published elsewhere in any form or language. Results are presented clearly, honestly, and without fabrication, falsification or inappropriate data manipulation (including image-based manipulation). Authors adhere to discipline-specific rules for acquiring, selecting and processing data.
Consent of Participate
The submitted work is experimental work performed in the laboratory. No human subject or living organism/tissue is involved in this research.
Consent to Publish
No human subject or living organism is involved in this research. So, no consent needed to publish is to be shared.
Declarations
- Author contributions
All authors contributed to the study conception and design. Material preparation, data collection and analysis were performed by Md Readion Islam and Mahmudul Hasan. The first draft of the manuscript was written by Md Readion Islam, Md Amir Hamja, Kanij Fatema, and Most Mozakkera Jahan, and all authors commented on previous versions of the manuscript. All authors read and approved of the final manuscript.
- Funding
The authors declare that no funds, grants, or other support were received during the preparation of this manuscript. The investigation was not funded by any organization or any sources.
- Data availability
Not applicable
- Competing interests
Not applicable
- Acknowledgments
We extend our deepest gratitude to the Center for Multidisciplinary Research and Development (CeMRD) for their resources, guidance, and support. The expertise and encouragement from CeMRD members have been invaluable. This research was made possible by the collaborative environment and cutting-edge facilities at CeMRD.
References
- 1.Ma, X., Wang, Y., and Wang, C., (2017). Low-carbon development of china’s thermal power industry based on an international comparison: review, analysis and forecast. Renewable and Sustainable Energy Reviews, 80: 942–970.
- 2.Wang, L., Wei, Y.-M., and Brown, M. A., (2017). Global transition to low-carbon electricity: A bibliometric analysis. Applied Energy, 205: 57–68.
- 3.Greenblatt, J. B., Brown, N. R., Slaybaugh, R., Wilks, T., Stewart, E., and McCoy, S. T., (2017). The future of low-carbon electricity. Annual Review of Environment and Resources, 42(1): 289–316.
- 4.Markandya, A., Armstrong, B. G., Hales, S., Chiabai, A., Criqui, P., Mima, S., Tonne, C., and Wilkinson, P., (2009). Public health benefits of strategies to reduce greenhouse-gas emissions: low-carbon electricity generation. The Lancet, 374: 2006–2015.
- 5.Furht, B., Villanustre, F., Najafabadi, M. M., Villanustre, F., Khoshgoftaar, T. M., Seliya, N., Wald, R., and Muharemagc, E., (2016). Deep learning techniques in big data analytics. Big Data Technologies and Applications, 133–156.
- 6.Hasan, M., Abedin, M. Z., Hajek, P., Coussement, K., Sultan, M. N., and Lucey, B., (2024). A blending ensemble learning model for crude oil price forecasting. Annals of Operations Research, 1–31.
- 7.Meddage, D., Ekanayake, I., Weerasuriya, A. U., Lewangamage, C., Tse, K. T., Miyanawala, T., and Ramanayaka, C., (2022). Explainable machine learning (xml) to predict external wind pressure of a low-rise building in urban-like settings. Journal of Wind Engineering and Industrial Aerodynamics, 226: 105027.
- 8.Theocharides, S., Theristis, M., Makrides, G., Kynigos, M., Spanias, C., and Georghiou, G. E., (2021). Comparative analysis of machine learning models for day-ahead photovoltaic power production forecasting. Energies, 14(4): 1081.
- 9.Akdi, Y., G¨olveren, E., and Okkao˘glu, Y., (2020). Daily electrical energy consumption: Periodicity, harmonic regression method and forecasting. Energy, 191: 116524.
- 10.Hanifi, S., Zare-Behtash, H., Cammarano, A., and Lotfian, S., (2023). Offshore wind power forecasting based on wpd and optimised deep learning methods. Renewable Energy, 218: 119241.
- 11.Gigoni, L., Betti, A., Crisostomi, E., Franco, A., Tucci, M., Bizzarri, F., and Mucci, D., (2017). Day-ahead hourly forecasting of power generation from photovoltaic plants. IEEE Transactions on Sustainable Energy, 9(2): 831–842.
- 12.Sharma, S., Khanra, P., and Ramkumar, K., (2021). Performance analysis of biomass energy using machine and deep learning approaches. Journal of Physics: Conference Series, IOP Publishing, 2089: 012003.
- 13.Mamun, M., Hasan, M., and An, K.-G., (2024). Advancing reservoirs water quality parameters estimation using sentinel-2 and landsat-8 satellite data with machine learning approaches. Ecological Informatics, 81:102608.
- 14.Ranstam, J. and Cook, J. A., (2018). Lasso regression. Journal of British Surgery, 105: 1348–1348.
Cite this article
Journal
Islam MR, Hasan M, Hamja MA, Fatema K, Jahan MM. Interpretable Machine Learning Approach to Forecast Sustainable Power Generation. JoSEP. 2026;2(1):113-117. doi: 10.62275/josep.25.1000018.
Rights and permissions
© 2026
Cited by (0)
Citing works are not available yet.
About this article
- Received
- 30 September 2024
- Revised
- 6 November 2024
- Accepted
- 12 November 2024
- Published
- 22 October 2026
- Journal
- Journal of Science and Engineering Papers
- Volume / Issue
- 2 / 1
- Pages
- 113-117
- DOI
- 10.62275/josep.25.1000018